I use Uptime Robot to monitor just about everything for our business. From our sites, to the sites of service-providers we use, to specific ports, to heartbeat-checks on our own bare-metal servers, but there's one thing that, until recently, I was having trouble using it for, live stream monitoring.

Now don't get me wrong, I had a monitor setup on the main domain of our CDN and our streaming provider, but, that's not really worth a whole lot. The main site and web-server could very easily be up, while streaming and HLS delivery was not operating at all, I wanted a better solution.
Enter HLSAnalyzer.com - a company I found through Google that, for a base-rate of $20/month for 5 streams, plus about $3.50/stream after that, will consistently monitor your HLS stream, report detailed stats, and send out alerts when there's a problem.
So I signed up and started testing and, well - it works really well. There's a few little nitpicks I have, namely, I wish it detected and resolved issues faster. See, it uses the buffer-size of your stream to determine issues, or to determine that issues have been resolved. This is good for accuracy, but bad for speed, as there are minimum thresholds involved in what constitutes an "alarm" state. Overall, it usually detects and reports an outage within 5 minutes of it occurring, and reports it resolved within 10 minutes of it being resolved. Not perfect, but not bad.
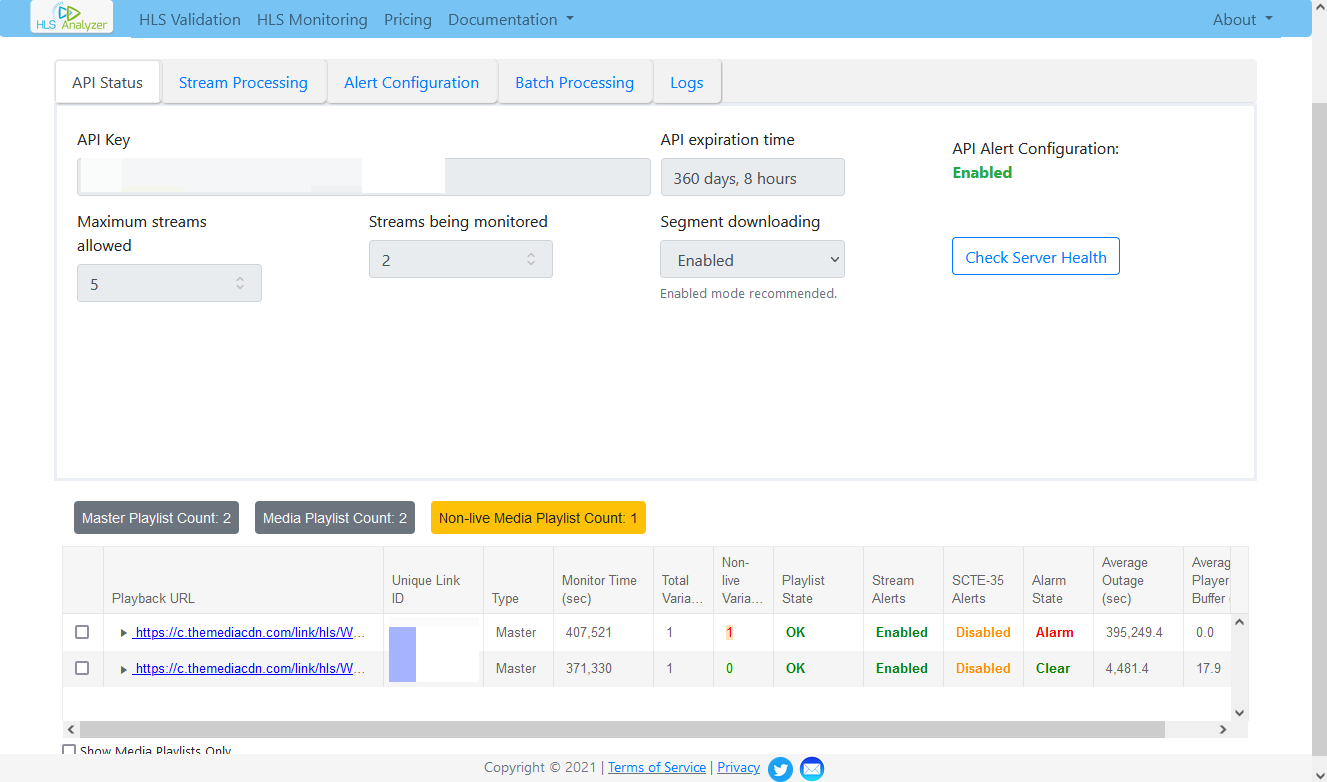
The HLSAnalyzer service itself advertises itself as API-based, but with a web-interface that can do pretty much all that you'd need - and that's correct, I haven't had to do any coding or mess with any API calls to use the service.
Notifications can be delivered either through e-mail (that's what we'll be using) or HTTP post calls.

So pretty much you just configure the parameters, link it up to your HLS stream, and it'll alert you of up and down events, really easy. You can also view detailed stats about the stream. And if that's where you want to end things, if e-mail alerts alone are good enough for you, thanks for reading!
But I wanted to implement this into my normal Uptime Monitor: Uptime Robot, for the benefit of just unifying everything, and also so it would feed to our status page. So let's dig into that...
Enter Zapier. If you haven't heard of Zapier before, it's basically a service for connecting different web-apps together. It works the same way as using various APIs, but it's for non-programmers. There's a free tier and some very reasonably-priced paid tiers.
![]()
Now, keep in mind, I am using a Pro Zapier Plan with the "paths" feature, which I'll demonstrate in this post. But it should be possible to re-create what I've done here on a Free Zapier plan, just by using two separate Zaps, however, I can't speak to what other limitations you may run into with the free plan.
Also keep in mind there's plenty of other services that do what Zapier does, this is just what I use. Just Google "Zapier Alternatives" and you'll find a goldmine.
Moving on to the setup, you can make changes as desired, but here's what you'll need if you want to follow along exactly:
- An HLSAnalyzer Account
- A paid Zapier account with the 'paths' feature
- A Google Drive / Docs Account
- An Uptime Robot Account
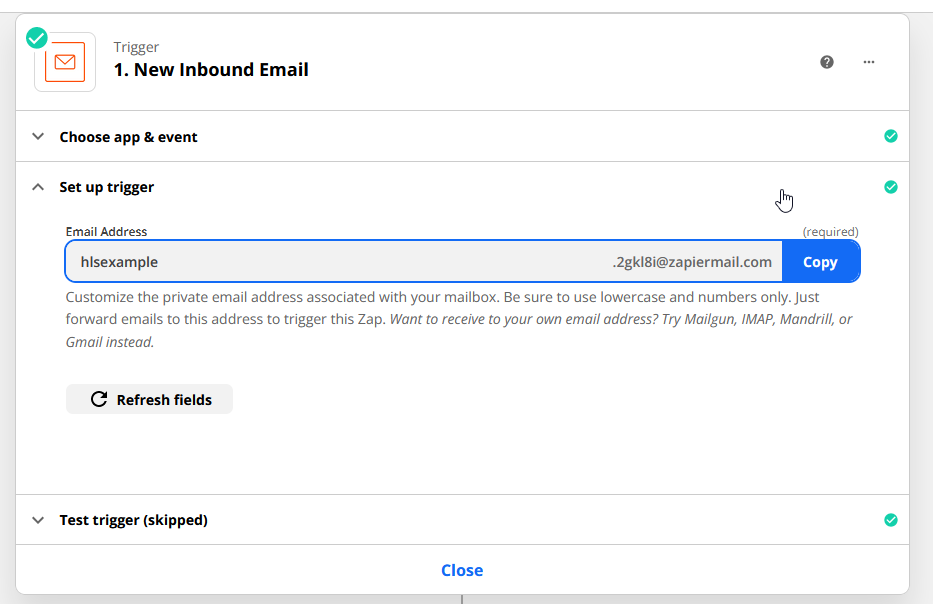
So what I've done in Zapier is create a Zap that is triggered by an incoming E-mail, Zapier helpfully provides an e-mail address you can use to receive triggers. I've copied this e-mail address as one of the recipient addresses in HLSAnalyzer, this is how HLSAnalyzer communicates with Zapier, it sends notification e-mails to an inbox connected to the Zap.

Next is the filter. Every HLSAnalyzer stream has a unique ID that it shows in the dashboard, and helpfully, also includes in it's Up and Down alert e-mails . Using this ID, we can introduce a filter into the Zapier chain so that only the stream we actually want to monitor will trigger the Zap to move forward. If you want to monitor if ANY stream goes down, you don't need this filter step.

Moving onto our final step, which is a path. This path conditionally runs either the 'Pass' or 'Fail' route, depending on what keyword the e-mail that was received contains.
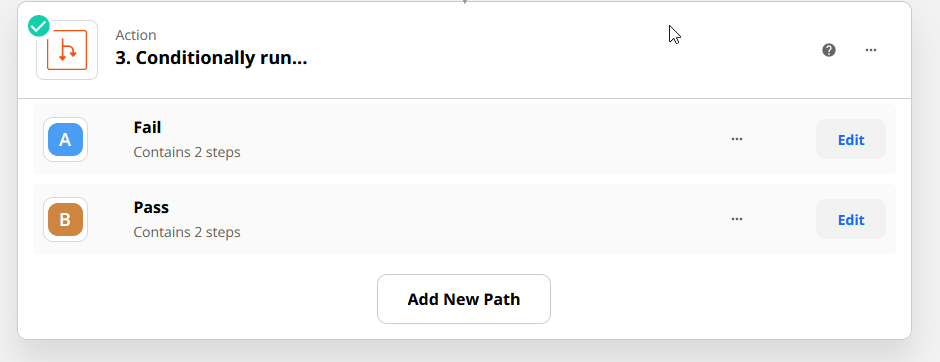
The fail path looks for the keyword "Outage Alert" in the subject of the e-mail, if that keyword is found, the path continues.

Once it continues, it does one thing: update the first cell in a Google Spreadsheet (any spreadsheet will do) with the word "OFFLINE" - This is what our uptime monitor will watch to determine the status, this spreadsheet.
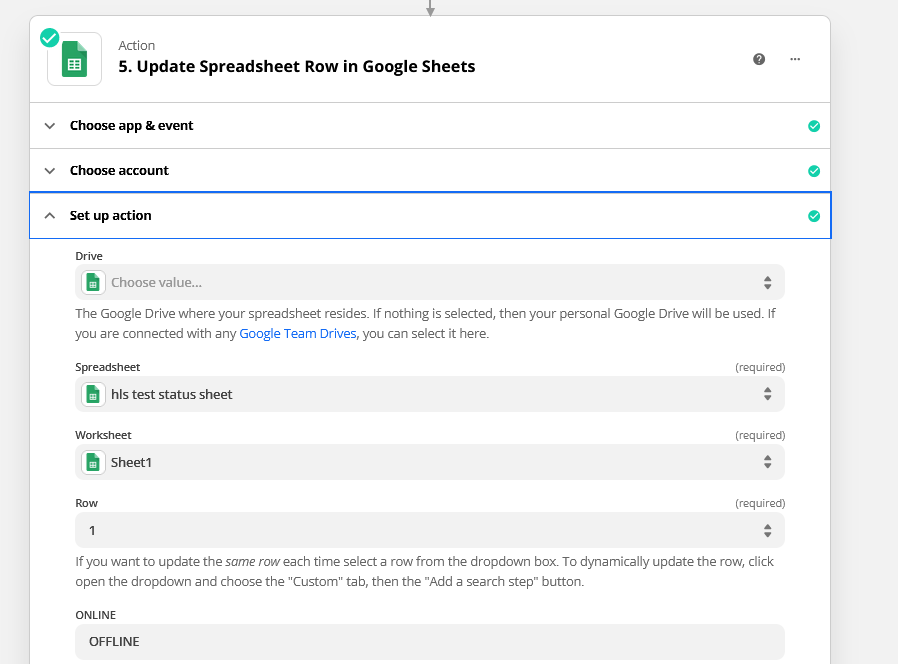
By now I think you're getting the picture, it's the same story for the "Pass" path, just give it the keyword to look for in the subject...
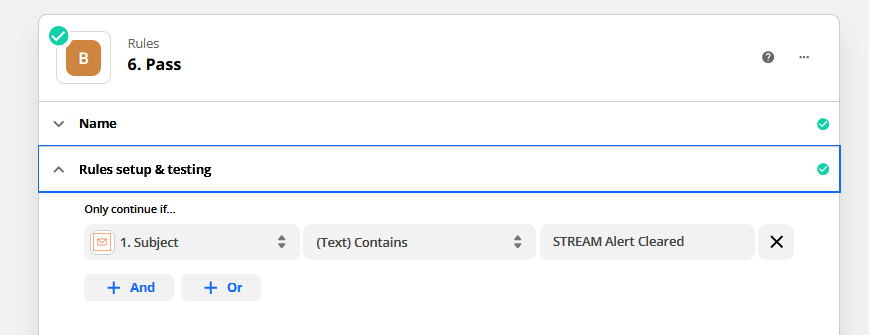
And tell it to write "ONLINE" to the first cell of the Google Sheet. (It needs to be the same cell in the same sheet that the "Offline" path uses, the status needs to change from one to the other, both should never be present.)
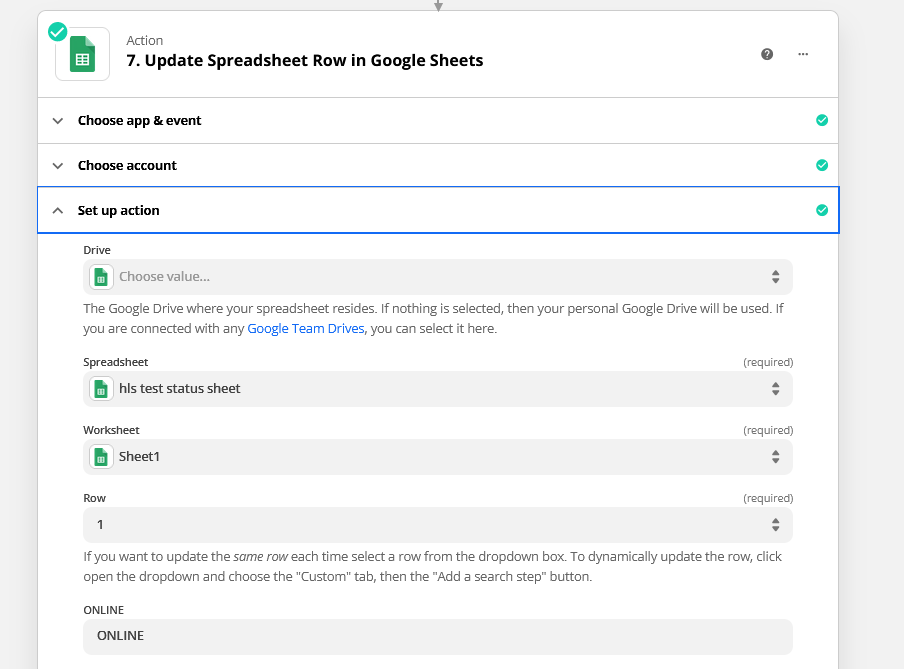
Now wrap things up, test your steps, name your Zap, and enable it, we're done with the Zapier part!

Now we just need one thing before we proceed to our uptime monitor - the static HTML link to that spreadsheet. So let's navigate to our Google Spreadsheet, go to File > Share > Publish to Web. Go ahead and make sure "Automatically Republish When Changes Are Made" is ticked, click publish, and get and copy your URL.

Now, finally, we're heading to UpTime Robot. We're going to create a new keyword monitor, it's going to alert us when the keyword (ONLINE) is NOT found, and it's going to point at, you guessed it, our spreadsheet.
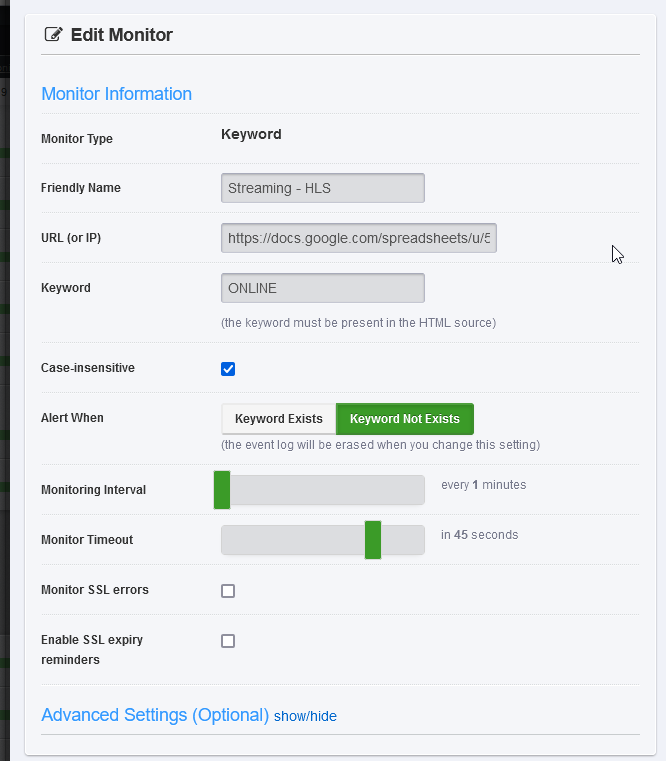
Setup your alert contacts and the rest of your standard fare for an uptime alert, and you're done! You now have an HLS Uptime Monitor that, as long as everything is working, will alert you within about 5-10 minutes of the stream going down, and 5-10 minutes of it coming back up.
Keep in mind we get these values partly because the previously mentioned way HLSAnalyzer works, but also because Google Sheets actually only updates the static output itself every 5 minutes, so that adds a bit of a variable. I actually did an alternate test to this, where instead of Google Sheets, Zapier creates an HTML file in Amazon S3 with the keyword, and it worked fine too, and updated instantly, so that's also an option.
As for 24/7 monitoring of just the server itself - I use Castr.io and their "Pre-Recorded Stream" feature, to broadcast a continuous feed of a 240p 500kbps test video to our streaming provider, and THAT is the HLS URL we monitor. We keep it such low quality because I mean, we pay for all the bandwidth we use.
Anyway, I hope this was helpful - take it easy!

